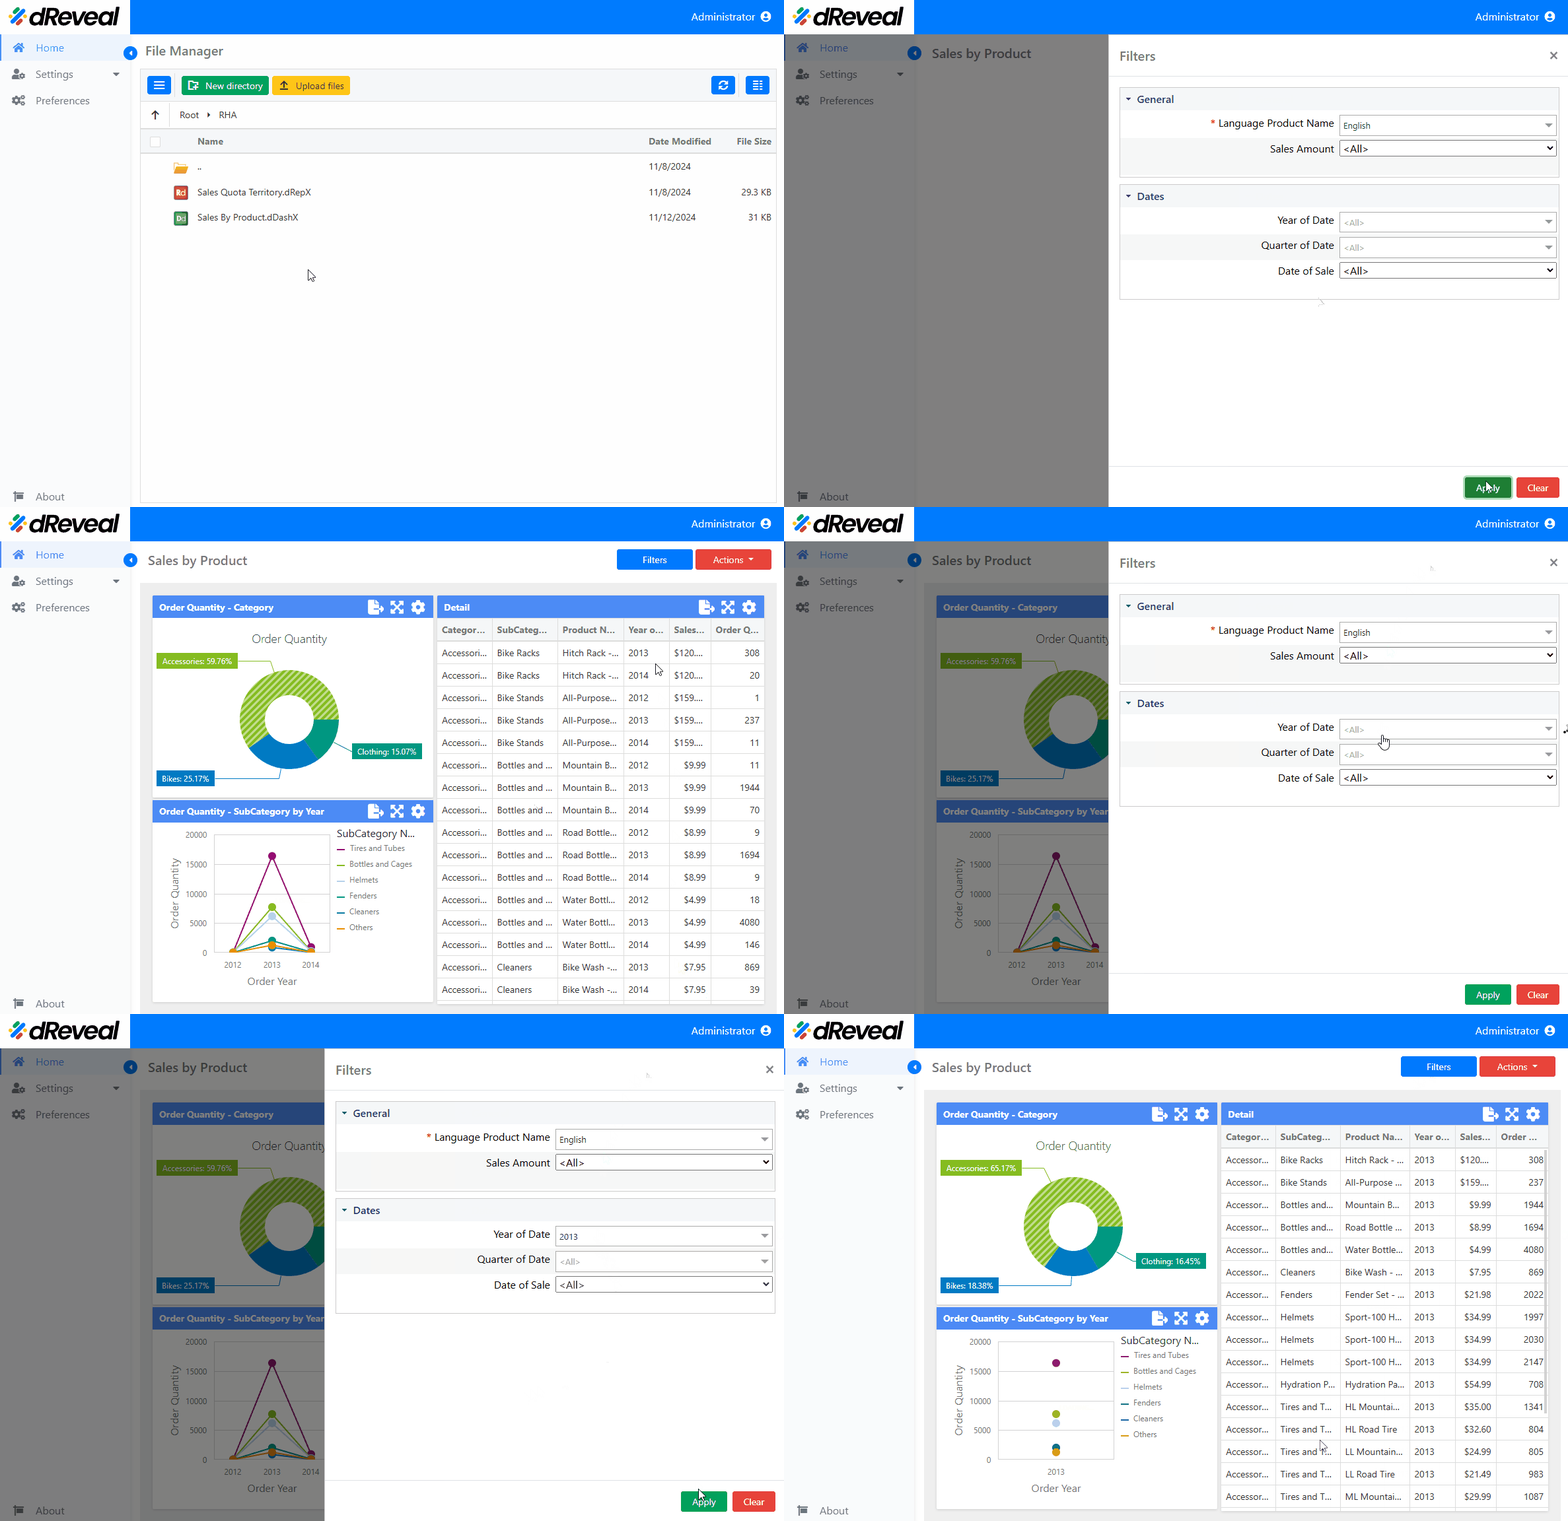
Filters
This functionality is essential in reports because it allows users to personalize the data displayed in real-time, in a dynamic and interactive way. Dashboards provide a variety of visualizations, such as charts, tables, and other visual elements, but it is the filters that make these reports highly personalized and useful for different analytical needs. With the filters, users can restrict and segment the data, enabling a more detailed and specific analysis without having to navigate through large amounts of information. The different types of filters are detailed below:
| Filter Type | Description |
|---|---|
| Default Values | Default values that are automatically applied to the filter. This helps set an initial option without the user having to select anything. |
| Boolean | A filter that allows you to select between two options: true or false. |
| Simple Selection | A filter that allows you to select a single option from a list. Useful when only one choice is needed from several available options. |
| Multiple Selection | A filter that allows you to select multiple options from a list. It enables the user to select more than one option, facilitating broader analysis. |
| Mandatory | A mandatory filter that requires a selection before proceeding. The user must make a selection for the report to be executed. |
| Cascading | A dependent filter that adjusts based on the selection of another filter. For example, the option selected in one filter may affect the available options in another filter. |
| Tree | A filter based on a hierarchical structure of options. It allows users to navigate through categories or subcategories. |
| Date | A filter that allows you to select a date or a date range. Ideal for filtering by specific time periods. This filter has the following options: On, After, Before, Between, Is Null, Not between, Is not null, This (Days, Weeks, Months, Quarters, Years), Next (Days, Weeks, Months, Quarters, Years), Last (Days, Weeks, Months, Quarters, Years),Today |
| Numeric | A filter based on numerical values, allowing comparisons or ranges. Useful for filtering numerical data within a specific range. This filter has the following options: Equal, Less than, Less than or equal, Great than, Great than or equal, Between, Is null, Not equal, Not between, Is not null |
By clicking the "Clear" button, all selected filter criteria are removed. To apply this action, click the "Apply" button so that the report reloads with the complete dataset, without any restrictions. This functionality is useful when users want to start over with new filter selections or simply view all the data without any applied filters. It ensures a refreshed view of the report, providing an easy way to reset the filtering options.
How to Apply Filters
To apply filters, first enter your username and password, then click on the Login button. Once logged in, navigate to the report you wish to execute. Double-click on the report to open it. Next, select the filters you need, and finally, click the Apply button to load and view the corresponding information.

